2727 Coworking Article
Analysis of Montreal's Traffic Congestion and Hotspots
Inside this article
Traffic Congestion in Montreal: Identifying the Worst Hotspots and Trends
Introduction: Montreal is renowned for its vibrant culture and historic charm, but it is equally notorious for traffic congestion. In 2023, Montreal drivers lost an average of 57 hours sitting in traffic, ranking the city 30th most congested in the world and the 2nd worst in Canada (after Toronto)[1]. This places Montreal’s congestion on par with, or even worse than, global cities like Berlin and Sydney[2]. The economic impact is substantial – a recent metropolitan report estimated over $6.1 billion in annual costs due to congestion in the Montreal region (about 2.1% of regional GDP)[3]. These costs include wasted time, fuel, and productivity, along with increased pollution and stress for commuters[3]. In this report, we identify the most congested highway and surface street in Montreal, analyze traffic patterns (daily peaks and seasonal variations), discuss key contributing factors (infrastructure, construction, commuting trends, and examine metrics such as delays, volumes, and speeds. We also consider impacts on logistics, public transit, and compare Montreal’s congestion to other major Canadian cities. All data and claims are supported by official sources like Transport Québec studies, the Canadian Automobile Association (CAA) bottleneck report, INRIX and TomTom traffic analyses, and municipal reports.
Montreal’s Worst Traffic Corridors
The Most Congested Highway: Autoroute 40 “Métropolitaine”
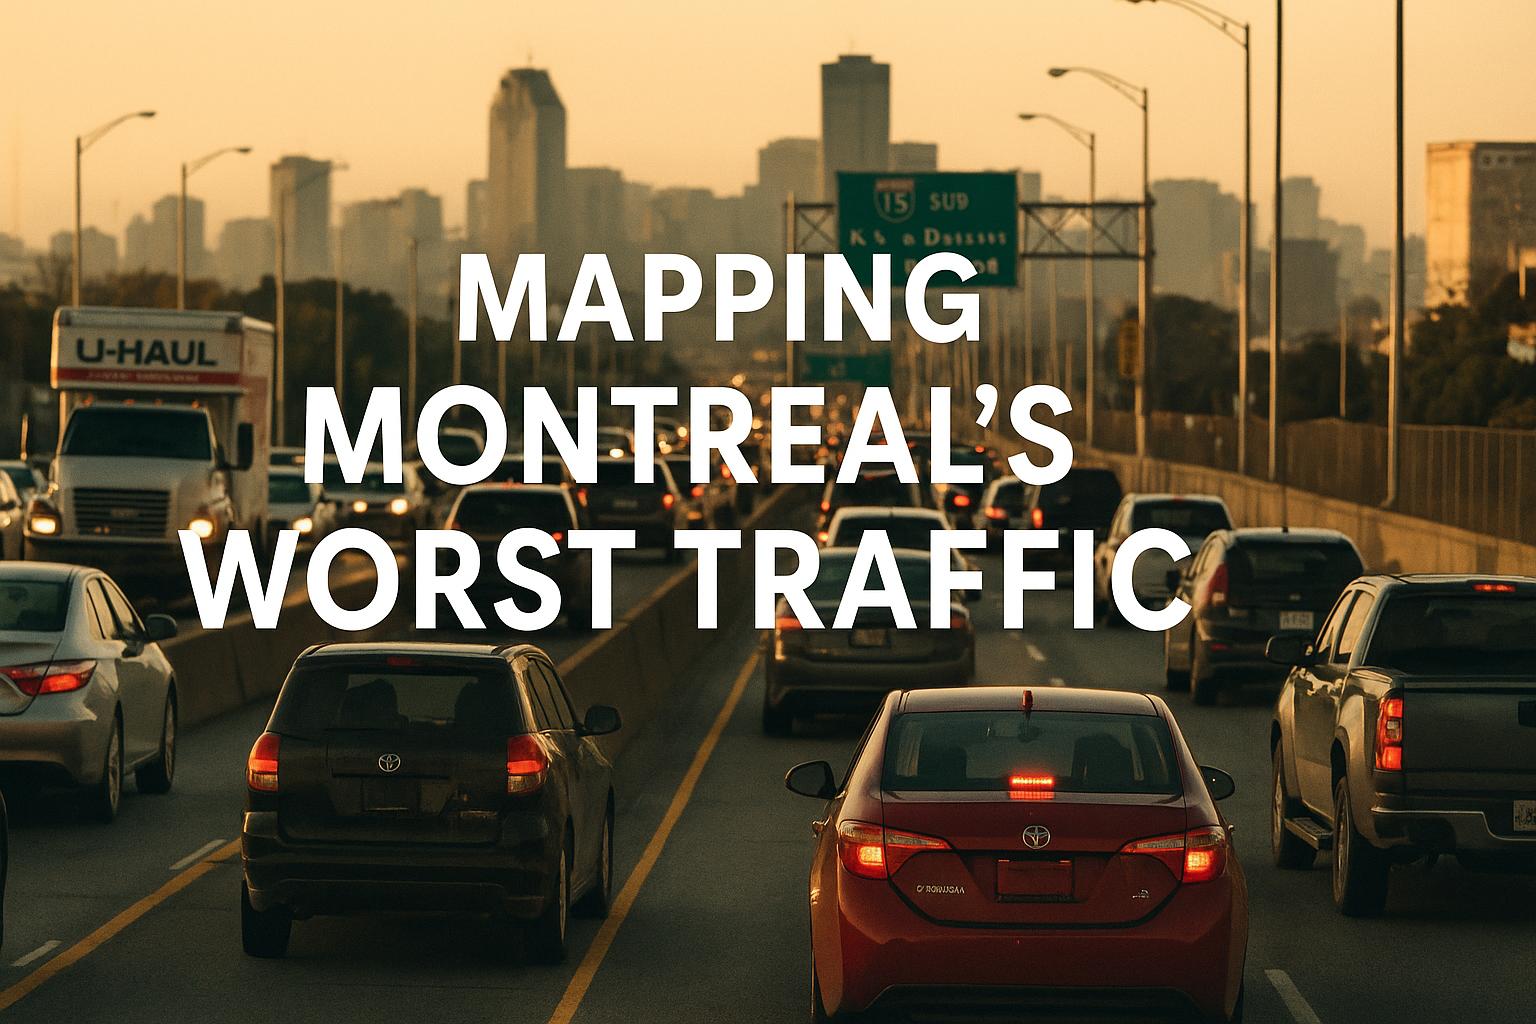
Traffic crawling on Montreal’s Autoroute 15 (Décarie Expressway) near the Turcot interchange, with overhead signs warning of “CONGESTION” ahead. The Décarie (A-15) and Métropolitaine (A-40) highways are routinely jammed at peak hours, reflecting Montreal’s severe highway bottlenecks.
When it comes to highways, Autoroute 40 (A-40) – known as the Métropolitaine Expressway – is consistently identified as Montreal’s worst traffic choke-point. The A-40 is an elevated east–west freeway slicing through the middle of the island, and it serves as the local segment of the Trans-Canada Highway. According to a national congestion study by the CAA, a 10 km stretch of A‑40 (the “Métropolitan” between Boulevard Pie-IX and Autoroute 520/Côte-de-Liesse) is the single worst bottleneck in Montreal and the 3rd worst in all of Canada[4]. Drivers on this stretch endure nearly 2 million hours of cumulative delay every year[4]. In practical terms, that means enormous daily queues: at peak periods, traffic often grinds along at under 50 km/h average speed – sometimes far below the 100 km/h speed limit – not just during rush hour but throughout most of the day[5]. The CAA report noted that on the Métropolitaine, “average travel speeds are consistently at or below 50 kph” across daytime hours[5], indicating an almost permanent state of congestion. This highway section alone costs commuters roughly $45 million per year in lost time and wastes about 1.3 million liters of fuel annually (with over 11 million kg of CO₂ emitted unnecessarily)[6] – a stark illustration of its impact.
Several factors explain why the A-40 is Montreal’s worst traffic corridor. Volume and demand play a primary role: as the CAA study describes, this is “the busiest section of the Trans-Canada Highway” in Montreal[6]. On a typical day, upwards of 180,000–190,000 vehicles travel on the Métropolitaine[7]. Official figures from Transports Québec confirm that up to 190,000 vehicles per day use A‑40 in this sector[7], an immense load for a highway originally built in the 1960s. This far exceeds the capacity at which free-flow conditions can be maintained, especially given the highway’s design. The section is an elevated six-lane freeway with closely spaced on/off ramps funneling traffic from major arteries like Pie-IX, St. Laurent/Carré Henri-Bourassa, and the Côte-de-Liesse interchange (A-520 to the airport). The constant merging and weaving, combined with short interchange distances, create turbulence that slows everyone down. Additionally, infrastructure limitations and ongoing maintenance aggravate congestion. The Métropolitaine’s aging concrete structure demands frequent repairs; lane closures for resurfacing or structural work are common, particularly during summer construction season (2023–2025 saw major repaving after previous work was found deficient[8]). Any such closure on the A-40 quickly triggers massive backups given the lack of alternative east–west expressways through the city.
Notably, Montreal’s geography and network layout funnel both local and through-traffic onto A-40. As an island city, Montreal has only a few bridge/tunnel crossings off the island and no complete ring road bypass; the A-40 is essentially the bypass for trucks and inter-city traffic as well as a commuter route. Thus, heavy truck volumes from the Port of Montreal and inter-provincial transport mix with daily commuters on this highway. The result is severe congestion that has drawn comparisons to notorious traffic in larger U.S. cities. Indeed, analysts have pointed out that Montreal’s A-40 bottleneck causes delays comparable to those in New York and Los Angeles[9]. One study noted that this Montreal corridor’s congestion levels are on par with those of the worst bottlenecks in Boston, MA[10], underscoring how a Montreal highway can resemble the traffic jams of a much larger metropolis.
Other Major Highway Bottlenecks: While A-40 (Métropolitaine) is the worst, it is not the only highway in Montreal plagued by chronic congestion. The CAA’s analysis highlighted that Montreal actually has 5 of the top 20 worst highway bottlenecks in Canada[11][12]. The second-worst in Montreal is Autoroute 15 (Décarie Expressway), which was ranked 5th nationwide[4][13]. The Décarie is a sunken north–south expressway running through the western central part of Montreal, connecting A-15 from the Turcot Interchange (A-20) up to the A-40 (Turcot and Décarie together form the main interchange between east-west and north-south highways). The Décarie corridor between the Turcot and Chemin de la Côte-Saint-Luc sees around 200,000 vehicles daily (similar volume to the Métropolitaine)[14].-44-chantiers-majeurs-sur-les-routes-du-grand-montreal-cet-ete#:~:text=n%C3%A9vralgique%20de%20l%E2%80%99autoroute%2040%20en,direction%20est)[15] and was found to impose about 812,000 hours of delay per year on drivers[16] – roughly 33 days’ worth of collective delays annually. Locals grimly joke that traffic on the Décarie “is bad 24/7, 365 days a year”, as one observer quipped[17]. While somewhat hyperbolic, this reflects the reality that even outside of typical rush hours, the Décarie often remains slow, and minor incidents or rain can rapidly cause traffic to seize up. Another major pinch-point is Autoroute 25 at the Louis-Hippolyte Lafontaine Tunnel (connecting to the south shore). The A-25 approach (between Rue Souligny and Rue Beaubien) ranked 8th worst in Canada[18] with over 250,000 hours of delay yearly[18]. This situation has worsened recently due to a multi-year tunnel rehabilitation project: since 2022 the Lafontaine Tunnel has had lane closures (only one lane toward Montreal open during construction), forcing tens of thousands of commuters to divert onto surface streets or endure long queues. Indeed, any incident or maintenance on Montreal’s limited river crossings (bridges/tunnels) immediately creates citywide traffic chaos. Other notable congested highways include stretches of Autoroute 20 (the Ville-Marie/Champlain bridge approach and the approach to the Honore-Mercier Bridge via Route 138) – which frequently back up during rush hour and were also listed in the top 20 national bottlenecks[19]. In summary, Montreal’s highways are heavily utilized and several key segments suffer from daily recurrent congestion as well as frequent “stop-and-go” conditions caused by accidents, weather, and roadwork.
The Most Congested City Street: Candidates and Analysis
Identifying the single most congested surface street in Montreal is challenging, as many arterial roads experience severe traffic, especially during rush hours. Unlike highways, arterial streets have traffic signals, crosswalks, and often lane reductions, so congestion is measured not just in slow speeds but also in travel time delays per distance. One strong contender for the worst-congested street is Sherbrooke Street (Rue Sherbrooke) – a major east–west artery that spans the island and passes through downtown. Sherbrooke is one of the city’s busiest thoroughfares and often serves as an alternate route when the A-720 (Ville-Marie Expressway) or other parallel routes are jammed. It carries heavy bus traffic and has extensive retail and institutional frontage (including universities and hospitals) that generate constant activity. Data collected by a Global News field experiment illustrates Sherbrooke’s congestion: even outside peak hours, travel on Sherbrooke can be extremely slow. In one test during early afternoon (non-rush hour), it took a news vehicle 22 minutes to drive just 3.4 km along Sherbrooke Street (from Atwater to Berri)[20]. This corresponds to an average speed of roughly 9 km/h, which is about the pace of a casual bicyclist. The delays were caused by multiple construction zones and “hordes of pedestrians” near McGill University, with police actively controlling intersections for heavy foot traffic[20]. In another segment of that experiment, a 0.9 km stretch on de la Montagne Street (a downtown north–south street feeding Sherbrooke) took 10 minutes to traverse due to construction, and a section of René-Lévesque Boulevard similarly was choked down to one lane, creating significant delay[21][22]. These examples underscore how Montreal’s downtown streets can become extremely congested even in midday, especially when compounded by road work and high pedestrian volumes. During typical weekday rush hours (7–9 AM and 4–6 PM), Sherbrooke and parallel avenues in the city’s core (René-Lévesque, de Maisonneuve, Notre-Dame, etc.) frequently see bumper-to-bumper traffic with stop-and-go movement between traffic lights.
Another notorious arterial is Notre-Dame Street East, particularly in the east end and approaching the tunnel/highway network. Notre-Dame serves as the main surface route for freight trucks to and from the Port of Montreal and also functions as an overflow route when the A-720/A-20 highway ends. It has long been slated for upgrade to a higher-capacity expressway, but until recently remains a wide boulevard with traffic lights. Commuters report that any street feeding the congested La Fontaine Tunnel (such as Notre-Dame in the east) experiences severe backups; one local noted Notre-Dame Est as “my vote” for worst congestion, especially with the ongoing tunnel lane closures[23]. Similarly, Boulevard Papineau (Route Papineau, part of Route 134) is often cited as a terribly congested city route. Papineau runs north–south and connects to the Jacques Cartier Bridge, one of the major bridges to the south shore. During evening rush hour, southbound Papineau is routinely jammed for several kilometers as vehicles queue to access the bridge. Drivers report that Papineau from about Beaubien Street down to Sherbrooke (approaching the bridge ramp) “sucks pretty bad” in rush hour[24], with long delays to travel a few blocks. This is a direct consequence of bottleneck at the bridge entrance (limited capacity and a toll plaza/light configuration) and heavy demand from commuters leaving downtown. Other candidates for worst congestion include René-Lévesque Boulevard East (an artery that narrows and carries high volumes near the new CHUM hospital), Saint Laurent Boulevard and Saint-Denis Street in the Plateau (both narrow, busy corridors), and Boulevard Pie-IX in the north end (which until recently had no metro line or train alternative, leading to heavy car and bus traffic – a new BRT line on Pie-IX has somewhat improved bus flow).
While it is hard to crown a single surface street as the worst, Sherbrooke Street stands out due to its length, central role, and documented delays. It is one of the longest urban streets and any disruption along it (construction, an accident, or a snowstorm) can produce gridlock that lasts hours. Moreover, Sherbrooke’s importance as a cross-town route means congestion there has spillover effects: for instance, traffic diverting from Highway 720 often floods Sherbrooke; similarly, when downtown events or protests close other streets, Sherbrooke bears the brunt. City data on traffic volumes show that certain sections of Sherbrooke handle tens of thousands of vehicles per day, placing it among the busiest city-owned roads. In sum, Montreal’s arterial street network suffers frequent and localized congestion – especially at bridge/tunnel approaches and in dense downtown areas. The worst street congestion typically coincides with rush hour peaks, but as noted, mid-day and weekend congestion can also be severe if there are construction closures or popular events. For example, Montreal’s downtown streets can be jammed on weekend afternoons during festivals or on game nights near the Bell Centre. The unpredictable nature of street congestion (due to traffic signals, pedestrians, double-parked delivery vehicles, etc.) makes it a persistent challenge. City officials often describe driving downtown in summer as “hellish” – “freedom and speed will not be on the agenda, there will be obstacles”, warned a Montreal spokesperson about the 2025 summer roadwork season[25].
Congestion Patterns: Daily Peaks and Seasonal Variations
Daily Rush Hour Trends: Montreal’s traffic follows the typical weekday pattern of morning and evening rush hour peaks, but with some notable characteristics. The morning peak generally runs from about 6:30 AM to 9:30 AM, as commuters from the suburbs and peripheral boroughs drive toward downtown job centers. The evening peak is slightly longer, roughly 3:30 PM to 6:30 PM, as workers depart the city (and on Fridays this can start earlier, ~2:30 PM, due to earlier departures/weekend travel). During these peak periods, travel times can increase dramatically – often double or triple the free-flow duration for many trips. For instance, according to the TomTom Traffic Index, a typical 10 km trip in Montreal that might take 12–15 minutes with no traffic can easily take 25–30+ minutes during rush hour, a congestion level of ~40–100% additional travel time. On the worst days, Montreal’s congestion index has reached around 40% on average (meaning trips take 1.4× longer than uncongested) and even higher during peak hours[26][27]. TomTom’s data for 2024 indicates Montreal’s evening commute is often the slowest, with Wednesday evenings in late fall 2024 being particularly bad (likely due to inclement weather and early nightfall)【0†source】. Notably, on highways like A-40 and A-15, congestion is not confined to a sharp peak. As discussed, those major bottlenecks see sustained congestion from morning through evening. Traffic analysts observe that on Montreal’s busiest highways, there is often only a brief mid-day respite around 11 AM–2 PM, and even then speeds remain moderate. Indeed, one description noted that on the worst Montreal corridors, “travel speeds remain low throughout the day” with little improvement outside the peak[5]. A local anecdote echoes this: “Weekday rush hour traffic is horrendous and lasts from 6 AM to 7 PM with a slight break from 11 AM–3 PM”, according to one frustrated commuter[28]. While 6 AM to 7 PM wall-to-wall congestion is an exaggeration, it captures the feeling that Montreal’s rush “hour” spans several hours each morning and afternoon, and midday traffic on key routes can still be sluggish.
Weekend and Off-Peak Patterns: Montreal’s congestion is not limited to weekdays. Weekend traffic can be surprisingly heavy on certain routes, especially in summer. Many Montrealers travel to cottages (“chalets”) or other leisure destinations on summer weekends, leading to Friday afternoon outbound traffic jams (for example, on Autoroute 15 north toward the Laurentians, starting in the city and stretching many tens of kilometers north – one resident notes this Friday flow is “pretty horrendous… up to Saint-Sauveur”[29]). Similarly, Sunday afternoon/evening often sees inbound congestion as people return to the city. Within the city, weekends bring shoppers and tourists; popular districts (Old Montreal, downtown shopping streets, Mount Royal Park access roads) can have clogged streets and scarce parking. Summer weekends also coincide with Montreal’s numerous festivals (Jazz Fest, Just for Laughs, etc.), which involve street closures and draw crowds, putting unusual pressure on the remaining open streets. Interestingly, weekend traffic on highways can be lighter than weekdays unless there are construction closures. However, Montreal has a tradition of scheduling major roadwork on weekends (to avoid weekday rush impact), which means full closures of highways or bridges on weekends are common in summer. These planned closures (often called “blitz” work) cause intense localized congestion on detour routes. For example, during summer 2023–2024, Transport Québec regularly shut down sections of A‑40 or A‑20 on weekends for construction, leading authorities to warn drivers to “avoid the area or expect major delays”[30][7]. In one case, a complete closure of A‑40 eastbound for a weekend was described as the “worst-case scenario” for traffic, effectively snarling the Met for days[7].
Seasonal Variations: Montreal’s congestion patterns also exhibit seasonal changes, largely due to weather and road construction cycles. Summer (May through September) is often the worst time for traffic overall, despite many people being on vacation in July. This is because summer is “orange cone season”, when the city and province undertake the majority of road construction, resurfacing, and infrastructure projects that can only be done in warm weather. In summer 2023, for example, Montreal drivers had to contend with 44 major highway construction sites around the region and over 1,000 local roadwork sites on the island[31][32]. The sheer number of work zones prompted warnings that getting around “will not be like a car commercial – freedom and speed will not be present”[25]. These projects often result in lane reductions or detours that last for weeks or months. Summer is also when bridge repair projects (e.g., on Mercier or Jacques-Cartier Bridge) are scheduled, sometimes necessitating partial closures. The combination of these factors means summer traffic can be very slow, particularly in detour corridors. On the other hand, winter (December through March) presents a different set of challenges. Montreal winters are harsh, with frequent snowstorms, freezing rain, and icy conditions. Bad winter weather can temporarily paralyze traffic across the city; a heavy snowstorm during rush hour will dramatically increase travel times (many Montrealers recall infamous snowstorms where highway travel times quintupled, turning a 30-minute commute into 3+ hours). Freezing rain and ice not only slow traffic for safety, but also lead to more accidents and road closures. As a Time Out report notes, winter weather “exacerbates” Montreal’s road issues, as snow and ice make travel dangerous and further pothole formation damages the road surface[33][34]. Interestingly, overall traffic volumes in winter might be slightly lower (some drivers avoid unnecessary trips, and there are school holidays in late December), but any volume reduction is often offset by reduced road capacity and speed due to weather. Montreal’s practice of efficient snow clearing mitigates long-term impacts – usually roads are cleared within hours after a storm – but during a storm, congestion skyrockets. Autumn and spring act as transition periods: September and October often see very heavy traffic as all commuters return after summer (and roadworks are still ongoing), whereas by late fall some road projects pause. Spring (March–April) has the added complication of thaw-related road damage (potholes) and the start of the next construction season. One positive note: during the Christmas holidays and the Québec construction holiday (last two weeks of July), traffic in Montreal is noticeably lighter, as many residents leave the city or stay off the roads. These are brief respites in an otherwise congested calendar.
Statistically, measurements confirm these patterns. A Transport Québec analysis found that in Montreal, about 43% of highway lane-kilometers are congested during the morning peak (and 44% in the PM peak), and similarly 42% of arterial road lane-km are congested at peak hoursbv.transports.gouv.qc.ca. This indicates nearly half of the city’s road network experiences slow-and-go conditions each rush hour – a proportion higher than in any other Canadian city. During the pandemic in 2020, congestion temporarily plummeted (volumes were ~83% of normal in 2020[35]), but by 2023 traffic had rebounded to 90–100% of pre-pandemic volumes in most sectors[35]. By late 2023 and 2024, congestion was only ~4% below 2019 levels[36] and climbing, suggesting that any pandemic relief was short-lived. In fact, 2024 is on track to exceed 2019 congestion, given the rising trend (a 20% increase from 2022 to 2023 in hours lost[36]). This resurgence has led to Montreal reclaiming its unenviable rank among North America’s worst cities for traffic (INRIX ranked Montreal the 9th most congested city in North America in 2023, alongside metropolises like New York, Mexico City, and Vancouver)[37].
Factors Contributing to Montreal’s Congestion
Multiple interrelated factors contribute to Montreal’s traffic woes:
-
Aging Infrastructure and Construction Projects: Montreal’s highway system was largely built in the 1950s–1970s and now requires extensive rehabilitation. Simultaneous major projects – such as the Turcot Interchange replacement (2015–2020), the new Champlain Bridge (opened 2019), and the ongoing Lafontaine Tunnel refurbishment (2022–2025) – have meant constant construction-related lane closures or detours. The city’s nickname “Orange Cone Capital” is well-earned: drivers face work zones year-round, but especially in summer. Poor coordination of construction has often been blamed – there have been cases where multiple parallel routes were under construction at once, leaving drivers with no good detour. Planned construction can make congestion predictable but unavoidable (e.g., knowing that half the lanes on a key highway are closed for months)[38]. The Time Out report highlights “poorly planned construction projects and lack of coordination between departments often lead to road closures and detours, disrupting traffic”[38]. In Montreal’s dense urban core, even minor roadwork can cause big traffic snarls due to limited alternate routes.
-
Road Design and Urban Layout: Montreal’s urban layout funnels traffic onto a few critical corridors. As an island, entry and exit points (bridges and tunnels) are chokepoints that create upstream congestion on approach roads. Within the city, the downtown street grid is relatively narrow and not built for high volumes – many streets are one-way, and there are virtually no wide boulevards beyond a couple of east-west axes. The city also lacks a comprehensive ring road. The A-15/A-40 form a partial beltway but not a full bypass; thus, through-traffic often mingles with local traffic. Some highway interchanges in Montreal are notoriously problematic – for example, the merge of A-20 eastbound onto the Décarie Expressway northbound involves an “on-ramp running into an off-ramp” within a short distance, causing weaving conflicts that back up traffic daily[39]. Antiquated designs like these (a result of 1960s era planning) are only slowly being corrected. The new Turcot interchange improved some flow, but other junctions (e.g., the A-13/A-40 interchange or the approach to A-13 north from A-40 west, which drivers call a “mess”[40]) remain troublesome. The dense urban environment also means limited road widening potential – many arterial roads cannot be expanded without costly expropriations, so they remain bottlenecked where demand exceeds capacity.
-
High Car Dependency and Commuting Patterns: Despite having Canada’s second-largest public transit system, Montreal still sees a majority of commuters driving in many parts of the metro area. Suburban development off-island (north and south of Montreal) has led to tens of thousands of daily car trips funneling into the city. Over the past decades, urban sprawl outpaced transit expansion, resulting in congested highways from bedroom communities. The metropolitan statistics show car mode share has stabilized but remains high, and total vehicle-kilometers traveled rebounded post-pandemic (Source: artm.quebec. Peak-hour congestion is amplified by commuters generally traveling at the same times (the standard 9–5 work schedule). Moreover, Montreal’s economic geography – with many jobs concentrated in downtown, but also certain industrial hubs (e.g., around the airport, or in the east island) – creates multiple congestion peaks on different axes. For example, the West Island to Downtown commute jams the A-20/Glenmore/720 corridor, the North Shore to Laval/Montreal commute jams the A-15 and A-13, while South Shore to Montreal jams the bridges (Champlain, Jacques-Cartier, Victoria) and connecting highways. The interplay of these flows means the city faces congestion on nearly all fronts simultaneously during rush hour.
-
Insufficient Transit Alternatives (Historically): While Montreal’s metro (subway) and commuter trains carry large numbers of passengers, some congested corridors have had limited transit service. For instance, until 2022, the Pie-IX corridor (in the densely populated east end) had no rapid transit line – it now has a Bus Rapid Transit line to help – so many residents drove or took slow buses. The off-island suburbs often have infrequent transit. The new Réseau Express Métropolitain (REM) electric rail system, partially opened in 2023, is intended to provide high-frequency transit from suburbs like Brossard (South Shore) and, soon, from West Island and North Shore, which should reduce car trips. Indeed, officials hope the REM will “help alleviate some of Montreal’s traffic issues” in the coming years[41]. However, currently the transit network, while extensive in the core, doesn’t fully offset the convenience of driving for many, especially as jobs are dispersed. When public transit budgets are cut (as happened in 2023, with a major shortfall for the regional transit agency【0†source】), it risks a downward spiral of fewer riders and more cars.
-
Road Surface Conditions: Montreal’s reputation for potholes and rough roads also contributes indirectly to congestion. Potholes can slow traffic (drivers swerving or slowing to avoid damage) and, more significantly, lead to emergency road repairs that require sudden lane closures. Springtime is especially bad – crews scramble to patch craters, often closing a lane during busy hours. The freeze-thaw cycles are severe in Montreal, so this is a chronic issue. In the INRIX 2023 report, Montreal’s infrastructure challenges (potholes, cracks) were noted as a significant concern impacting travel reliability[42]. Even when not directly causing a jam, bad road conditions can reduce average speeds and increase accident risk (a blown tire or bent rim from a pothole can stall a lane).
-
Weather and Incidents: As mentioned, winter storms cause intermittent but severe congestion spikes. A snow squall at rush hour can bring highways to a crawl. Montreal drivers are accustomed to snow, but only up to a point – when a major blizzard hits, the city may advise people to stay off the roads entirely. Accidents are another factor: on congested roads, even a minor fender-bender can create outsized delays. For example, a stalled car on the A-40 shoulder often causes “gawker” slowdowns that can back up traffic for kilometers. The incident clearance times in Montreal can be slow if the roads are jammed (tow trucks struggle to reach the scene). All these random factors layer on top of the baseline congestion.
-
Coordination and Policy: Montreal’s congestion is also a result of policy decisions. There has historically been reluctance to implement measures like congestion pricing or widespread demand management. High-occupancy vehicle (HOV) lanes exist on a few approaches (A-10 Champlain bridge approach has a bus/HOV lane, A-15 south has one toward Champlain), but most highways have no HOV lanes. Until recently, the concept of tolling or charging for road use to manage demand was politically unpopular (beyond existing bridge tolls on A-25 and A-30). The new mobility trends (work-from-home, etc.) might even out peaks a bit, but thus far the data shows people have largely returned to old commuting habits[36]. On a positive note, Montreal has invested in bike lanes and telework promotion, which could gradually help if more commuters shift modes. The city is also redesigning certain streets (adding bus lanes, traffic light priority for transit (Source: stm.info) to maximize throughput without widening. Still, these solutions will take time to markedly reduce congestion.
In summary, Montreal’s congestion is a multifaceted problem: an old road network stretched to its limits by high demand, compounded by constant construction and harsh climate, and not sufficiently mitigated (yet) by alternatives like transit or policy interventions. As one local radio traffic reporter put it, “pretty much every artery is affected by works – moving around Montreal won’t be easy”[43][44]. This confluence of factors creates the everyday reality of slow commutes and unpredictability.
Traffic Metrics and Impacts
To quantify Montreal’s traffic problems, it helps to examine some key metrics:
-
Hours of Delay: As noted earlier, Montreal drivers lost 57 hours per year on average in traffic delays in 2023[1]. This was a sharp increase (+20%) from 2022 as congestion rebounded[36]. In total, for the region, this amounts to tens of millions of hours of lost time annually when considering all drivers. The top bottlenecks alone accounted for over 3 million hours of delay per year (five worst segments combined)[11]. Such delays translate not only to frustration but also to tangible economic costs in lost productivity.
-
Congestion Index / Travel Time Index: Montreal’s congestion level (per TomTom) averaged around 38–40% in 2023-24, meaning a trip takes ~1.4 times as long as in free-flow conditions. In peak periods, specific corridors have congestion levels of 80–100%+ (i.e., travel times double or more). For example, TomTom data indicated that in 2023 a standard 10 km trip in Montreal took about 19 minutes on average (citywide) – up by 10 seconds from 2022 – but in rush hour that ballooned to well over 25 minutes[45][46]. By comparison, Toronto’s 10 km takes 29 minutes at rush (due to worse downtown traffic)[46]. Montreal’s citywide average speed during peak was measured at about 18 km/h (Toronto 18 km/h as well, Vancouver ~24 km/h)[46]. These figures align with the anecdotal evidence that in heavy congestion, one can often bike faster than driving in downtown Montreal. Indeed, Toronto and Montreal both saw average rush-hour speeds under 20 km/h in 2023[46].
-
Traffic Volume: On highways, Montreal’s highest AADT (Annual Average Daily Traffic) counts are around 180k–200k vehicles (A-40 and A-15)[7][47], as mentioned. Many other highways (A-20, A-13, A-25) carry 100k+ vehicles daily on busy sections. Key bridges: the Samuel-De Champlain Bridge carries ~50 million vehicles per year (pre-pandemic) or about 130k per day, and the Jacques-Cartier Bridge around 90k per day, so these approach capacities at peak times. On city streets, the busiest arterials (e.g., parts of Sherbrooke, Côte-de-Liesse service road, René-Lévesque, Pie-IX) may see 30–60k vehicles per day depending on the section. Even mid-sized avenues in central areas handle 20k+. The high volume on relatively narrow streets means any incident or blockage quickly triggers backups.
-
Vehicle Flow and Speeds: Free-flow highway speeds in Montreal (when attainable) are typically 100 km/h (the default speed limit on most autoroutes). However, the effective rush-hour speed on congested autoroutes can drop to 20–40 km/h. In extreme cases like the Décarie Expressway, it’s not uncommon to see stop-and-go flow with speeds under 10–15 km/h for extended stretches during rush hour. City street speeds are much lower by design (speed limits 30–50 km/h in the city). The STM (Montreal’s transit agency) notes that its buses have an average operating speed of only ~18 km/h(Source: stm.info – reflecting frequent stops, but also heavy traffic. In fact, in 2016 the average STM bus speed was measured at 17.7 km/h[48] and trending downward slightly as congestion increased. This indicates that general traffic in the city doesn’t move much faster than 18 km/h on average either. A revealing metric from the CMM (Montreal Metropolitan Community) is that during peak periods, over 40% of the road network is congested (defined typically by volume-to-capacity or speed drop thresholds)bv.transports.gouv.qc.ca – so nearly half the network is effectively in a state of slow flow at any given rush hour.
-
Reliability: Another important aspect is travel time reliability – in Montreal this is quite poor. Commuters often have to allow a large buffer because an unexpected delay (due to an accident or weather) is common. The variability in travel time can be high – a 30 minute commute on a good day might take 50–60 minutes on a bad day. This unreliable travel time is costly for freight and transit scheduling. The phrase “Montreal traffic is unpredictable” is often heard; however, certain bottlenecks are reliably bad every day (e.g., A-40 at 5 PM will be slow – that much is predictable).
-
Incident Metrics: Montreal experiences a significant number of traffic accidents and stalls each year, many of which occur in congested conditions. While exact numbers are beyond our scope, the impact is reflected in the congestion cost. The $6.13 billion annual congestion cost figure includes things like delay cost for passenger vehicles and freight, extra fuel consumed, and indirect costs[3]. Part of this cost arises from incident-related delays that are above the recurrent congestion.
These metrics underscore that Montreal’s congestion is not just a minor inconvenience – it has quantifiable, large-scale effects on time, money, and the environment. The wasted fuel from idling vehicles is huge: the top 20 Canadian bottlenecks (five in Montreal) collectively waste 22 million liters of fuel per year[49][50]; Montreal’s share is several million liters (the Métropolitaine bottleneck alone wasted ~4.2 million liters annually in 2015[51]). For greenhouse gas emissions, the delays on Montreal’s five worst jams equated to roughly 18,000 tonnes of CO₂ emitted unnecessarily[52]. Vehicle emissions from congested stop-go traffic also worsen local air quality. This has public health implications; for example, neighborhoods near the Metropolitan Expressway have higher exposure to pollution due to the constant traffic jam there. Public health studies in Montreal have warned of the elevated pollutants near highways carrying 200k vehicles/day[53].
Impact on Logistics, Transit, and the Economy
Freight and Logistics: Montreal is a transportation hub – home to the Port of Montreal, a major international port, as well as significant rail and trucking operations. Traffic congestion directly impacts freight movement. Trucks stuck in traffic face higher operating costs (fuel and driver time) and unreliable delivery schedules. A Canadian National Observer report pointed out that one Montreal bottleneck (the A-40 stretch) had congestion comparable to Boston’s, emphasizing how it slows down commerce[54]. The 11.5 million hours of delays per year from Canada’s worst bottlenecks[55] hit trucking companies hard – a portion of that is in Montreal. For the Port of Montreal, which relies on timely truck drayage of containers, chronic congestion on routes like Notre-Dame East and the approach to the bridge/tunnel system can disrupt supply chains. Logistics firms must pad their delivery times, and sometimes shift to off-peak trucking (e.g. moving goods late at night) to avoid gridlock. This comes with costs such as night shift premiums. The Montreal Metropolitan Observatory estimated congestion costs related to business and freight transportation as part of that $6 billion figure[3] – including lost productivity and extra logistics expenses. In essence, congestion acts like a “tax” on economic activity: goods take longer to reach markets, workers take longer to get to jobs. Certain industries, such as distribution and manufacturing, may limit their growth or location in areas if traffic is consistently bad. There’s also the risk of missed Just-In-Time deliveries for factories due to unpredictable travel times.
Public Transit: Traffic congestion has a two-fold relationship with public transit in Montreal. On one hand, severe traffic provides a rationale for more people to use transit, since the Montreal Metro (subway) is immune to surface congestion and can often be faster than driving during rush hour. Indeed, Montreal’s Metro is extensive in the core and carries over 1 million trips per day[56]. In areas well-served by the Metro or commuter trains, many commuters avoid driving specifically to escape traffic and save time (for example, commuters from Laval or Longueuil can park-and-ride into the Metro, bypassing bridge traffic). The new REM line to the South Shore attracted strong ridership upon opening in mid-2023, partly because it cut a reliable path through the congestion of the Champlain Bridge corridor. However, transit is also a victim of traffic in the case of buses. Montreal operates hundreds of bus routes, and outside of dedicated reserved lanes, buses are slowed by the same congestion cars are. The STM acknowledges that “the constant increase in traffic and construction has affected bus speed in Montréal”, necessitating frequent schedule adjustments to account for longer travel times (Source: stm.info(Source: stm.info. The average bus speed (18 km/h) means buses spend a lot of time stuck or crawling, which undermines their attractiveness. The city has been implementing Bus Priority Measures (BPM) – such as reserved bus lanes on major streets, transit signal priority, etc. – to improve this. As of recently, there are over 300 km of bus lanes across the city, which the STM claims can reduce bus travel times by around 10%(Source: stm.info. Notable examples include the Pie-IX BRT, reserved lanes on René-Lévesque and on Notre-Dame in certain sections, and approach lanes on bridges for buses. These help, but where buses still mix with general traffic, they suffer. For instance, on the heavily congested Côte-Vertu and Saint-Michel boulevards (north end), buses frequently bunch up due to traffic delays.
Montreal’s transit agencies often pitch transit investments as congestion solutions. The rationale is clear: each full bus or train can take dozens of cars off the road. The metropolitan plan explicitly calls for major transit expansion to curb congestion growth[57]. However, until transit service is fast and convenient enough, many commuters still opt to drive. There is also an equity dimension – many lower-income workers rely on buses from areas that also have heavy traffic, compounding their commute difficulty. Furthermore, when traffic is gridlocked, emergency services and surface transit all get impeded, raising safety concerns (e.g., ambulances struggling through downtown jams).
Local Economy and Quality of Life: The economic impact of Montreal’s congestion is not just on freight but on the overall productivity of the city. Those 57 hours per driver per year lost are essentially non-productive time. If you aggregate that, it means hundreds of thousands of working hours not spent on work or leisure. A portion of the $6 billion cost is in lost productivity – time employees could have spent working or with family. Congestion can deter some economic activities: for example, businesses might find it harder to attract customers or talent if getting around is too painful. A commuter faced with a 90-minute traffic jam might decide against taking a certain job or might be less productive due to stress. The Board of Trade of Metropolitan Montreal has long raised congestion as an issue impacting the region’s competitiveness.
There are also environmental and health costs. The additional emissions contribute to climate change and local smog (Montreal had episodes of poor air quality in summers, partly due to vehicle emissions and heat). Noise pollution from honking and idling is another quality-of-life issue for residents near busy corridors. The frustration and stress of daily traffic can have mental health impacts. Studies in other cities have correlated long car commutes with higher stress and lower overall satisfaction; this likely holds in Montreal, where “road rage” and exhaustion from traffic are common complaints. In extreme instances, gridlock can interfere with city events or tourism – though Montreal manages event traffic fairly well through street closures and transit accommodation, an overwhelmed traffic system can mar the experience of visiting (imagine a tourist stuck in a cab in a jam for an hour – not a great first impression).
Comparison with Other Canadian Cities
In a Canadian context, Montreal’s traffic is among the worst, but not absolutely the worst. Toronto consistently ranks slightly worse: in 2023 Toronto drivers lost about 63 hours in congestion vs Montreal’s 57[58], and Toronto was 17th worldwide vs Montreal 30th[59]. Toronto’s large size and reliance on the busy Highway 401 (North America’s busiest highway) contribute to that. In fact, Canada’s #1 and #2 worst bottlenecks were in Toronto (Highway 401 segments)[60][61], but Montreal’s Métropolitaine was #3 nationally[62]. Vancouver is the other city in the conversation – Vancouver had ~49 hours lost per driver (2023)[58], a bit less than Montreal, but Vancouver’s unique geography causes intense bottlenecks on limited bridges (much like Montreal). It ranked 56th globally[59]. Cities like Calgary, Edmonton, Ottawa fare much better in congestion (e.g., Calgary’s hours lost were in the 20s, and Ottawa around 25–30 hours by some measures[63]). Those cities have less dense cores and, in Calgary/Edmonton’s case, more road capacity per capita. Montreal, by contrast, has a dense core, an island constraint, and a relatively older infrastructure, which make its congestion more comparable to the largest world cities. It’s telling that Montreal’s congestion was worse than that of many larger cities globally – for instance, Montreal ranked above cities like Amsterdam, Rome, and Sydney in the INRIX congestion list[2]. This highlights that Montreal’s issues are not just due to city size but due to structural factors discussed earlier.
However, Montreal’s situation is not static – it can learn from or be contrasted with others. Toronto has embarked on some ramp metering and HOV lanes; Vancouver has limited road expansion by policy but invested heavily in transit (SkyTrain). Montreal’s current trajectory, if no action is taken, could see congestion costs rise to $10 billion by 2030[64] as projected by the CMM, given trends. That has spurred regional planners to emphasize transit-oriented development and highway operation improvements. One difference is that Montreal has not implemented tolls or congestion pricing (aside from a couple of tolled bridges), whereas some global cities (London, Singapore) have, to successfully manage congestion. The political appetite in Montreal/Quebec for such measures is uncertain, but as congestion nears pre-pandemic peaks, there may be renewed pressure for bold solutions.
Mitigation Efforts and Future Outlook
Addressing Montreal’s traffic congestion requires a multi-pronged approach, and several efforts are underway or proposed:
-
Public Transit Expansion: The single most cited solution is improving public transit to offer a viable alternative to driving. The opening of the REM light-rail network is a major step – the first line (REM South Shore) already removes an estimated tens of thousands of car trips from the Champlain Bridge corridor by providing a 18-minute rail ride that replaces a much longer car slog. Upcoming REM branches to the West Island and North Shore (Deux-Montagnes) in 2024–2025 will further integrate the transit network. Additionally, Montreal’s bus network is being restructured with new “express” and frequent lines, and the Metro’s Blue Line extension toward Montreal’s northeast is slated for completion later this decade. The CMM explicitly notes that “substantial investments in developing transit and maintaining the existing network” are necessary for a “durable reduction of congestion and its costs”[57]. By increasing transit capacity and coverage, the aim is to shift more commuters out of single-occupant cars, thereby reducing peak demand on roads.
-
Traffic Management and Infrastructure Improvements: In the short term, better traffic management can ease some congestion. The city and province have intelligent transportation systems (ITS) such as real-time traffic monitoring, signal coordination, and ramp metering on a few autoroutes. These could be expanded. Synchronized traffic lights on major corridors (as mentioned by the STM, they are implementing priority signal systems (Source: stm.info) can improve flow for both cars and buses. On highways, filling critical gaps or bottlenecks – for instance, completing missing links or adding lane capacity at chronic merge points – may provide relief. A case in point is the ongoing project to rebuild the Lafontaine Tunnel with improved safety and capacity (though not adding lanes, it will have better geometry). Another example is the consideration of a new bridge or tunnel to the east to alleviate the overloaded ones – a long-discussed idea of an eastern bypass/link that could divert traffic away from the core. While no firm plan exists, the pressure of congestion keeps these ideas alive. Smaller-scale improvements like redesigning on/off ramps (to avoid the dangerous “on-ramp into off-ramp” situations) are also being done when possible during reconstructions.
-
Demand Management: Encouraging telecommuting and flexible work hours is another strategy. The pandemic showed that remote work can significantly cut traffic. Many Montreal employers continue to offer hybrid work, which on any given day reduces the number of commuters. Staggered work hours (not everyone 9–5) can flatten the peak. The government has considered incentives for off-peak commuting or carpooling. Carpooling itself is aided by some HOV lanes (e.g., on A-20 approaching downtown in the morning). There are also discussions around congestion pricing – for example, charging vehicles entering the busiest parts of downtown – but this is in early stages of public debate.
-
Active Transportation: Montreal has invested in biking infrastructure, being one of the more bike-friendly North American cities. The city’s BIXI bike-share system and extensive protected bike lanes (over 900 km of bike paths citywide) provide alternatives for certain trips. While not directly reducing highway congestion, more cyclists can mean fewer cars on short urban trips, easing local street traffic. Walking, too, is being encouraged by improved pedestrian amenities. Land-use planning that brings workplaces and homes closer (transit-oriented development, denser neighborhoods) is part of the long-term strategy to reduce trip lengths and dependence on cars, thus mitigating congestion.
Montreal’s officials often emphasize that there is no single “magic” solution; rather, a combination of expanded transit, smarter road management, and policy incentives will be required. Some relief is expected as big construction projects finish – for instance, when the Lafontaine Tunnel renovations conclude (scheduled by 2025-26), those lane closures will end, potentially restoring some capacity. Likewise, once the Turcot and Champlain projects fully settled, there was some improvement in those corridors (removing old bottleneck structures). However, given growth in travel demand, any freed capacity tends to get filled quickly (a phenomenon known as induced demand). Thus, Montreal’s challenge is ongoing.
In conclusion, Montreal’s worst traffic locations – the Métropolitaine Expressway (A-40) among highways, and major urban arteries like Sherbrooke Street – exemplify the city’s congestion problem in microcosm. The daily scene of cars crawling along these roads is the result of various systemic issues discussed above. The impacts are felt broadly: by commuters losing time, by businesses incurring higher costs, and by the city contending with environmental and health externalities. While Montreal’s congestion ranks among the worst in North America and the world, the city is actively seeking solutions through infrastructure investments and policy changes. Whether these will significantly improve the situation in coming years remains to be seen, but the consensus is that without action, Montreal could grind to a halt (“Montreal, dans les bouchons” as local media often phrase it). On the flip side, with strategic improvements, Montreal can aspire to reduce those lost hours and ease the daily burden on its roads – restoring a bit of the joie de vivre that heavy traffic currently dampens for many. As one transport expert optimistically put it, Montreal’s congestion is “bad, but not intractable – we know the recipe: better transit, better planning”. The next decade will test the city’s ability to follow through on that recipe and reclaim smoother mobility for its residents.
Sources:
-
CAA & CPCS (2017). Grinding to a Halt: Canada’s Worst Highways – Montreal bottleneck data[6][4][16].
-
Transports Québec / Communauté Métropolitaine de Montréal (2024). Congestion cost and extent – $6.13B cost, 57 hours lost[3][36], network congestion percentagesbv.transports.gouv.qc.ca.
-
INRIX Global Traffic Scorecard (2023). City rankings and hours lost – Montreal #30 worldwide (57 hrs) vs Toronto (63 hrs)[1][58].
-
TomTom Traffic Index (2024). Montreal traffic profile – congestion levels ~40%, travel times for 10 km[46][45].
-
Journal de Montréal (May 14 2025). “44 chantiers majeurs” – A-40 volume ~190k/day, summer construction impacts[7][25].
-
Global News (2017). Montreal has 5 of Canada’s busiest roads (CAA) – A-40 ~2 million hrs delay, A-15 812k hrs[4][16].
-
Global News (2016). Driving experiment – 6 km in 40 min off-peak (Sherbrooke 3.4 km in 22 min)[65][20].
-
Time Out Montreal (June 27 2024). Why so much traffic? – cites potholes, weather, construction coordination issues[42][38].
-
Reddit Montreal (2023). Commuter perspectives – anecdotes on worst traffic (Sherbrooke, Papineau, tunnel approaches, Décarie)[39][24].
-
STM (2020). Bus network data – average bus speed ~18 km/h, effect of traffic and priority measures (Source: stm.info(Source: stm.info.
-
CityNews Montreal (2024). Traffic worst in world rank – confirms Montreal 57 hrs, image of Décarie traffic[66][67].
-
Observatoire de la CMM (2024). Press release on congestion – need for transit investment for sustainable congestion reduction[57].
-
Wikimedia Commons – Traffic congestion in Montreal images (e.g., Décarie “Congestion” sign photo)[68][69].
![[68]](https://commons.wikimedia.org/wiki/File:Congestion.jpg#:~:text=Add%20a%20one,what%20this%20file%20represents)
![[69]](https://commons.wikimedia.org/wiki/File:Congestion.jpg#:~:text=Description%20Congestion,Flickr%2C%20was%20uploaded%20to%20Commons)
External Sources (69)
About
2727 Coworking
2727 Coworking is a vibrant and thoughtfully designed workspace ideally situated along the picturesque Lachine Canal in Montreal's trendy Griffintown neighborhood. Just steps away from the renowned Atwater Market, members can enjoy scenic canal views and relaxing green-space walks during their breaks.
Accessibility is excellent, boasting an impressive 88 Walk Score, 83 Transit Score, and a perfect 96 Bike Score, making it a "Biker's Paradise". The location is further enhanced by being just 100 meters from the Charlevoix metro station, ensuring a quick, convenient, and weather-proof commute for members and their clients.
The workspace is designed with flexibility and productivity in mind, offering 24/7 secure access—perfect for global teams and night owls. Connectivity is top-tier, with gigabit fibre internet providing fast, low-latency connections ideal for developers, streamers, and virtual meetings. Members can choose from a versatile workspace menu tailored to various budgets, ranging from hot-desks at $300 to dedicated desks at $450 and private offices accommodating 1–10 people priced from $600 to $3,000+. Day passes are competitively priced at $40.
2727 Coworking goes beyond standard offerings by including access to a fully-equipped, 9-seat conference room at no additional charge. Privacy needs are met with dedicated phone booths, while ergonomically designed offices featuring floor-to-ceiling windows, natural wood accents, and abundant greenery foster wellness and productivity.
Amenities abound, including a fully-stocked kitchen with unlimited specialty coffee, tea, and filtered water. Cyclists, runners, and fitness enthusiasts benefit from on-site showers and bike racks, encouraging an eco-conscious commute and active lifestyle. The pet-friendly policy warmly welcomes furry companions, adding to the inclusive and vibrant community atmosphere.
Members enjoy additional perks like outdoor terraces and easy access to canal parks, ideal for mindfulness breaks or casual meetings. Dedicated lockers, mailbox services, comprehensive printing and scanning facilities, and a variety of office supplies and AV gear ensure convenience and efficiency. Safety and security are prioritized through barrier-free access, CCTV surveillance, alarm systems, regular disinfection protocols, and after-hours security.
The workspace boasts exceptional customer satisfaction, reflected in its stellar ratings—5.0/5 on Coworker, 4.9/5 on Google, and 4.7/5 on LiquidSpace—alongside glowing testimonials praising its calm environment, immaculate cleanliness, ergonomic furniture, and attentive staff. The bilingual environment further complements Montreal's cosmopolitan business landscape.
Networking is organically encouraged through an open-concept design, regular community events, and informal networking opportunities in shared spaces and a sun-drenched lounge area facing the canal. Additionally, the building hosts a retail café and provides convenient proximity to gourmet eats at Atwater Market and recreational activities such as kayaking along the stunning canal boardwalk.
Flexible month-to-month terms and transparent online booking streamline scalability for growing startups, with suites available for up to 12 desks to accommodate future expansion effortlessly. Recognized as one of Montreal's top coworking spaces, 2727 Coworking enjoys broad visibility across major platforms including Coworker, LiquidSpace, CoworkingCafe, and Office Hub, underscoring its credibility and popularity in the market.
Overall, 2727 Coworking combines convenience, luxury, productivity, community, and flexibility, creating an ideal workspace tailored to modern professionals and innovative teams.
Disclaimer
This document is provided for informational purposes only. No representations or warranties are made regarding the accuracy, completeness, or reliability of its contents. Any use of this information is at your own risk. 2727 Coworking shall not be liable for any damages arising from the use of this document. This content may include material generated with assistance from artificial intelligence tools, which may contain errors or inaccuracies. Readers should verify critical information independently. All product names, trademarks, and registered trademarks mentioned are property of their respective owners and are used for identification purposes only. Use of these names does not imply endorsement. This document does not constitute professional or legal advice. For specific guidance related to your needs, please consult qualified professionals.